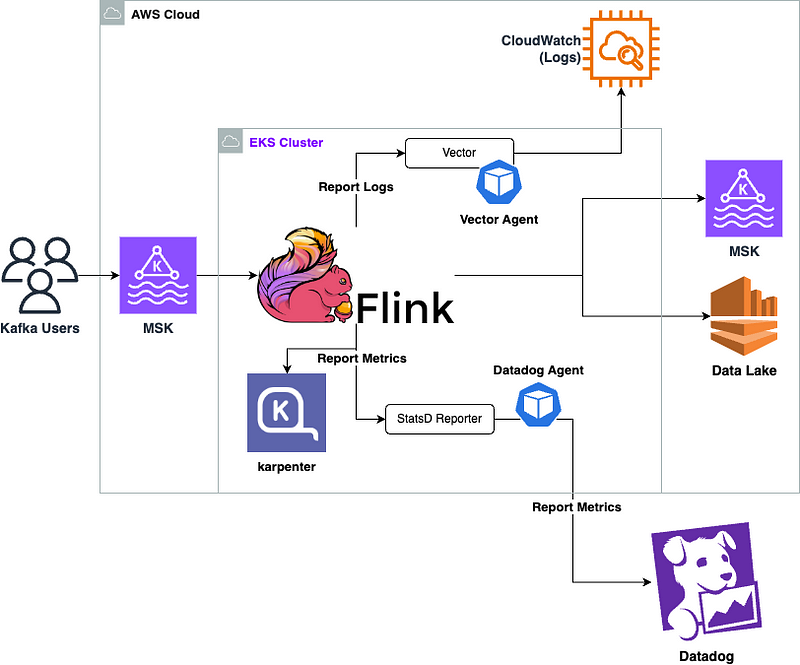
Our design approach involved setting up the Flink on Kubernetes operator. We also integrated cert-manager to manage webhooks for the Flink- Kubernetes operator.
Afterward, We created a customized Helm chart that contained the FlinkDeployment. This allowed each Flink job to easily use the Helm library as a wrapper and adjust values based on specific environmental and job requirements.
To ensure each Flink job had an isolated environment, we integrated Kubernetes Cluster Autoscaler (Karpenter).
For monitoring purposes, metrics were sent to Datadog by configuring the JMX in our Flink job. Logging was directed to CloudWatch using Fluent Bit, which was installed via its Helm chart. Alternatively, we could have included Fluent Bit as a sidecar container in our FlinkDeployment.
Overview of solution

Topics Covered:
1. Flink Operator Installation — Setting up the Operator
2. Flink Deployment Specification — Running an Example
3. Metric Delivery — Sending Metrics to Datadog
4. Log Delivery — Sending Logs to CloudWatch
5. Karpenter Setup — Scaling Machines on Demand
6. Cluster Role Configuration — Managing Flink Jobs Permissions
Flink Operator — Helm Chart Operator
Within our Flink infrastructure, we rely on Apache Flink version 1.7.0. As a preliminary step before installing the Helm Operator, we ensure the installation of cert-manager, a prerequisite for seamless operation.
Install the cert-manger:
kubectl create -f https://github.com/jetstack/cert-manager/releases/download/v1.8.2/cert-manager.yaml
Next, we’ll proceed with installing the Flink Operator Chart and we’ll make adjustments to the configuration within the chart to enable the exposure of custom metrics according to our requirements.
Install the Flink Operator Chart:
helm repo add flink-operator-repo https://downloads.apache.org/flink/flink-kubernetes-operator-1.7.0/ && \
helm install flink-kubernetes-operator -f - flink-operator-repo/flink-kubernetes-operator <<EOF
defaultConfiguration:
  flink-conf.yaml: |+
    # Flink Config Overrides
    kubernetes.operator.metrics.reporter.prom.factory.class: org.apache.flink.metrics.prometheus.PrometheusReporterFactory
    kubernetes.operator.metrics.reporter.prom.port: 9999
metrics:
  port: 9999
EOF
Flink Deployment Spec
The Flink Operator extend the functionality of the Kubernetes API by introducing new object types. In our scenario, the FlinkDeployment defines deployments for Flink applications.
Once the Flink Operator is installed and operational in your Kubernetes environment, it continually monitors FlinkDeployment objects submitted by users to detect new changes.
You’ll find many examples of FlinkDeployment here. In our configuration, we will deploy one of the autoscaling:
kubcetl apply -f https://raw.githubusercontent.com/apache/flink-kubernetes-operator/release-1.7.0/examples/autoscaling/autoscaling.yaml
Metrics — deliver to Datadog
We send our exposed metrics directly to Datadog. To do this, we use Datadog’s OpenMetrics integration and set annotations according to their requirements. This setup allows us to manage which metrics are included or excluded and attach relevant tags. By making default metrics accessible on port 9999 and defining annotations for specific metrics, we ensure Datadog gathers only the metrics we’ve chosen.
Here’s an example of how our Flink Deployment Pod Template is configured:
apiVersion: flink.apache.org/v1beta1
kind: FlinkDeployment
metadata:
...
spec:
...
  podTemplate:
    kind: Pod
    apiVersion: v1
    metadata:
      ...
      annotations:
        configmap.reloader.stakater.com/reload: "flink-config-{{ .Release.Name }}"
        ad.datadoghq.com/tags: '{"env": "{{- include "flink-deployment.shortEnv" . }}", "region": "{{ .Values.region }}", "app": "{{ .Release.Name }}", "owner": "{{ .Values.owner }}", "repo": "{{ .Values.repo }}", "job_name": "{{ .Release.Name }}"}'
        ad.datadoghq.com/flink-main-container.check_names: '["openmetrics"]'
        ad.datadoghq.com/flink-main-container.init_configs: '[{}]'
        ad.datadoghq.com/flink-main-container.instances: '[{"openmetrics_endpoint": "http://%%host%%:9999/metrics",
          "metrics": ["flink_taskmanager_job_task_operator_KafkaSourceReader.*", "flink_taskmanager_job_task_operator_IcebergStreamWriter.*",
           "flink_taskmanager_job_task_operator_EndPointDiscovery.*", "flink_taskmanager_job_task_operator_IcebergFilesCommitter.*",
            "flink_taskmanager_job_task_operator_ClickHouseDataSource.*", "flink_taskmanager_job_task_operator_datalake.*",
            "flink_taskmanager_job_task_operator_discoverEndpointDatalake.*", "flink_jobmanager_job_num.*", "flink_jobmanager_job_lastCheckpointDuration",
            "flink_jobmanager_num.*", "flink_taskmanager_Status_JVM_Memory_Heap_Used", "flink_taskmanager_Status_JVM_CPU_Load",
            "taskmanager_Status_JVM_GarbageCollector_G1_Young_Generation_Time", "taskmanager_Status_JVM_GarbageCollector_G1_Old_Generation_Time",
            "flink_jobmanager_job_downtime", "flink_jobmanager_job_uptime", "flink_jobmanager_job_numberOfCompletedCheckpoints"]}]'
        ad.datadoghq.com/tolerate-unready: "true"
    spec:
      ...
Logs — Deliver to CloudWatch
To handle logs, we follow AWS’s guidelines for deploying Fluent Bit to send container logs to CloudWatch Logs. Fluent Bit is configured as a DaemonSet to enable log delivery to CloudWatch Logs. We use the aws-for-fluent-bit chart, because it gives us the flexibility to adjust log inclusions and exclusions within our infrastructure.
For instance, we exclude logs from Spark, Datadog, EMR, etc:
helm repo add flink-operator-repo https://downloads.apache.org/flink/flink-kubernetes-operator-1.7.0/ && \
helm upgrade --install aws-for-fluent-bit --namespace kube-system -f - eks/aws-for-fluent-bit <<EOF
aws-for-fluent-bit:
  input:
    enabled: true
    # tag: "kube.*"
    path: /var/log/containers/*.log
    db: "/var/log/flb_kube.db"
    multilineParser: "docker, cri"
    memBufLimit: 5MB
    skipLongLines: "On"
    refreshInterval: 10

    extraInputs: |
      Exclude_Path      /var/log/containers/*spark*.log,/var/log/containers/*datadog*.log,/var/log/containers/*emr*.log
EOF
Karpenter — Scaling up on demand
In our setup, we allocate machines per Flink job. Each of the Flink jobs has its own provisioner.
You can also find the installation here
helm upgrade --install --namespace karpenter --create-namespace \
  karpenter oci://public.ecr.aws/karpenter/karpenter \
  --version 0.34.0 \
  --set "serviceAccount.annotations.eks\.amazonaws\.com/role-arn=${KARPENTER_IAM_ROLE_ARN}" \
  --set settings.clusterName=${CLUSTER_NAME} \
  --set settings.interruptionQueue=${CLUSTER_NAME} \
  --wait
Cluster role — Flink Jobs permissions
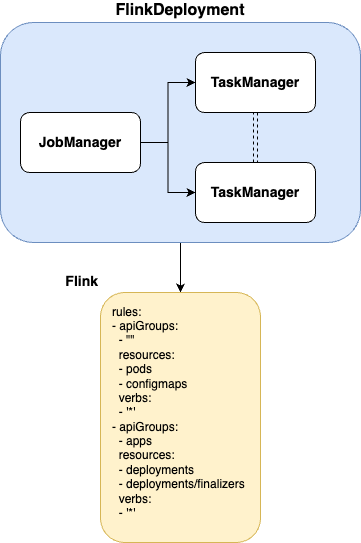
The Flink Operator has two roles:
- Managing flinkdeployments
- Enabling the JobManager to create and manage TaskManagers and ConfigMaps for the job.
Since our setup with Flink Jobs is per namespace, we created a ClusterRole and attached (ClusterRoleBinding) it to each of our Flink deployments.

Recap
We’ve learnt how to install Apache Flink Operator on Kubernetes, while focusing on deployment techniques, metrics handling, and logging.
We showcased the installation of the Flink Operator and cert-manager, with a sample FlinkDeployment setup. In addition, we chose to send the metrics to Datadog, and logs which are managed with Fluent Bit to CloudWatch. As well, we guided you through our scaling decision that we chose to use Karpenter.