Goodbye to the headaches of manual infrastructure management, and hello to a more efficient and scalable approach with ArgoCD.
If you’re tired of managing your infrastructure manually, ArgoCD is the perfect tool to streamline your processes and ensure your services are always in sync with your source code. With ArgoCD, any changes made to your version control system will automatically be synced to your organization’s dedicated environments, making centralization a breeze. Say goodbye to the headaches of manual infrastructure management and hello to a more efficient and scalable approach with ArgoCD!
This post will teach you how to easily install and manage infrastructure services like Prometheus and Grafana with ArgoCD. Our step-by-step guide makes it simple to automate your deployment processes and keep your infrastructure up to date.
We will explore the following approaches:
- Installation of ArgoCD via Helm
- Install Prometheus via ArgoCD
- Install Grafana via ArgoCD
- Import Grafana dashboard
- Import ArgoCD metrics
- Fire up an Alert
Prerequisites:
Installation of ArgoCD via Helm
To install ArgoCD via Helm on a Kubernetes cluster, you need to:
- Add the ArgoCD Helm chart repository.
- Update the Helm chart repository.
- Install the ArgoCD Helm chart using the Helm CLI.
Finally, verify that ArgoCD is running by checking the status of its pods.
# Create a namespace
kubectl create namespace argocd

# Add the ArgoCD Helm Chart
helm repo add argo https://argoproj.github.io/argo-helm

# Install the ArgoCD
helm upgrade -i argocd --namespace argocd --set redis.exporter.enabled=true --set redis.metrics.enabled=true --set server.metrics.enabled=true --set controller.metrics.enabled=true argo/argo-cd

# Check the status of the pods
kubectl get pods -n argocd
When installing ArgoCD, we enabled two flags that exposed two sets of ArgoCD metrics:
- Application Metrics :
controller.metrics.enabled=true - API Server Metrics :
server.metrics.enabled=true
To access the installed ArgoCD, you will need to obtain its credentials:
Username: adminPassword:
kubectl -n argocd \
get secret \
argocd-initial-admin-secret \
-o jsonpath="{.data.password}" | base64 -d
Link a Primary Repository to ArgoCD
ArgoCD uses the Application CRD to manage and deploy applications. When you create an Application CRD, you specify the following:
Sourcereference to the desired state in Git.Destinationreference to the target cluster and namespace.
ArgoCD uses this information to continuously monitor the Git repository for changes and deploy them to the target environment.
Let’s put it into action by applying the changes:
cat <<EOF | kubectl apply -f -
apiVersion: argoproj.io/v1alpha1
kind: Application
metadata:
  name: workshop
  namespace: argocd
spec:
  destination:
    namespace: argocd
    server: https://kubernetes.default.svc
  project: default
  source:
    path: argoCD/
    repoURL: https://github.com/naturalett/continuous-delivery
    targetRevision: main
  syncPolicy:
    automated:
      prune: true
      selfHeal: true
EOF
Let’s access the server UI by using the kubectl port forwarding:
kubectl port-forward service/argocd-server -n argocd 8080:443Connect to ArgoCD.
Install Prometheus via ArgoCD
By installing Prometheus, you will be able to leverage the full stack and take advantage of its features.
When you install the full stack, you will get access to the following:
- Prometheus
- Grafana dashboard, and more.
In our demo, we will apply from the Kube Prometheus Stack the following services:
- Prometheus
- Grafana
- AlertManager
The node-exporter will add the separately with its own helm chart while deactivating the pre-installed default that comes with the Kube Prometheus Stack.
There are two ways to deploy Prometheus:
- Option 1: By applying the CRD.
- Option 2: By using automatic deployment based on the kustomization.
In our blog, the installation of Prometheus will happen automatically, which means that Option 2 will be applied automatically.
Option 1 — Apply the CRD
cat <<EOF | kubectl apply -f -
apiVersion: argoproj.io/v1alpha1
kind: Application
metadata:
  name: prometheus
  namespace: argocd
spec:
  destination:
    name: in-cluster
    namespace: argocd
  project: default
  source:
    repoURL: https://prometheus-community.github.io/helm-charts
    targetRevision: 45.6.0
    chart: kube-prometheus-stack
EOF
Option 2 — Define the Installation Declaratively
This option has already been applied based on the CRD we deployed earlier in the step of linking a primary repository to ArgoCD.
The CRD is responsible for syncing our application.yaml files with the configuration specified in the kustomization.
After Prometheus will get deployed, then it exposes its metrics to /metrics. To display these metrics in Grafana, we need to define a Prometheus data source.
In addition, we also have additional metrics that we want to display in Grafana, so we’ll need to scrape them in Prometheus.
Access the Prometheus server UI
Let’s access Prometheus by using the kubectl port forwarding:
kubectl port-forward service/kube-prometheus-stack-prometheus -n argocd 9090:9090Connect to Prometheus.
Prometheus Node Exporter
For the installation of the Node Exporter, we utilized the declarative approach, which also happened in Option 2. The installation process will happen automatically, just like it occurred in Option 2, once we link the primary repository to ArgoCD.
We will specify the configuration for the Node Exporter’s application using a declarative approach.
Prometheus Operator CRDs
Due to an issue with the Prometheus Operator Custom Resource Definitions, we have decided to deploy the CRD separately. The installation process will be automatic, similar to the one in Option 2, which relied on linking a primary repository to ArgoCD in an earlier step.
Install Grafana via ArgoCD
We used the same declarative approach as Option 2 to define the installation of the Grafana. The installation process will take place automatically, just like it does in Option 2, following the earlier step of linking a primary repository to ArgoCD.
Since the Grafana installation is part of the Prometheus stack, it was installed automatically when the Prometheus stack was installed.
To access the installed Grafana, you will need to obtain its credentials:
Username: adminPassword:
kubectl get secret \
-n argocd \
kube-prometheus-stack-grafana \
-o jsonpath="{.data.admin-password}" | base64 --decode ; echo
Let’s access Grafana by using the kubectl port forwarding:
kubectl port-forward service/kube-prometheus-stack-grafana -n argocd 9092:80Connect to Grafana.
Importing the ArgoCD Metrics Dashboard Into Grafana
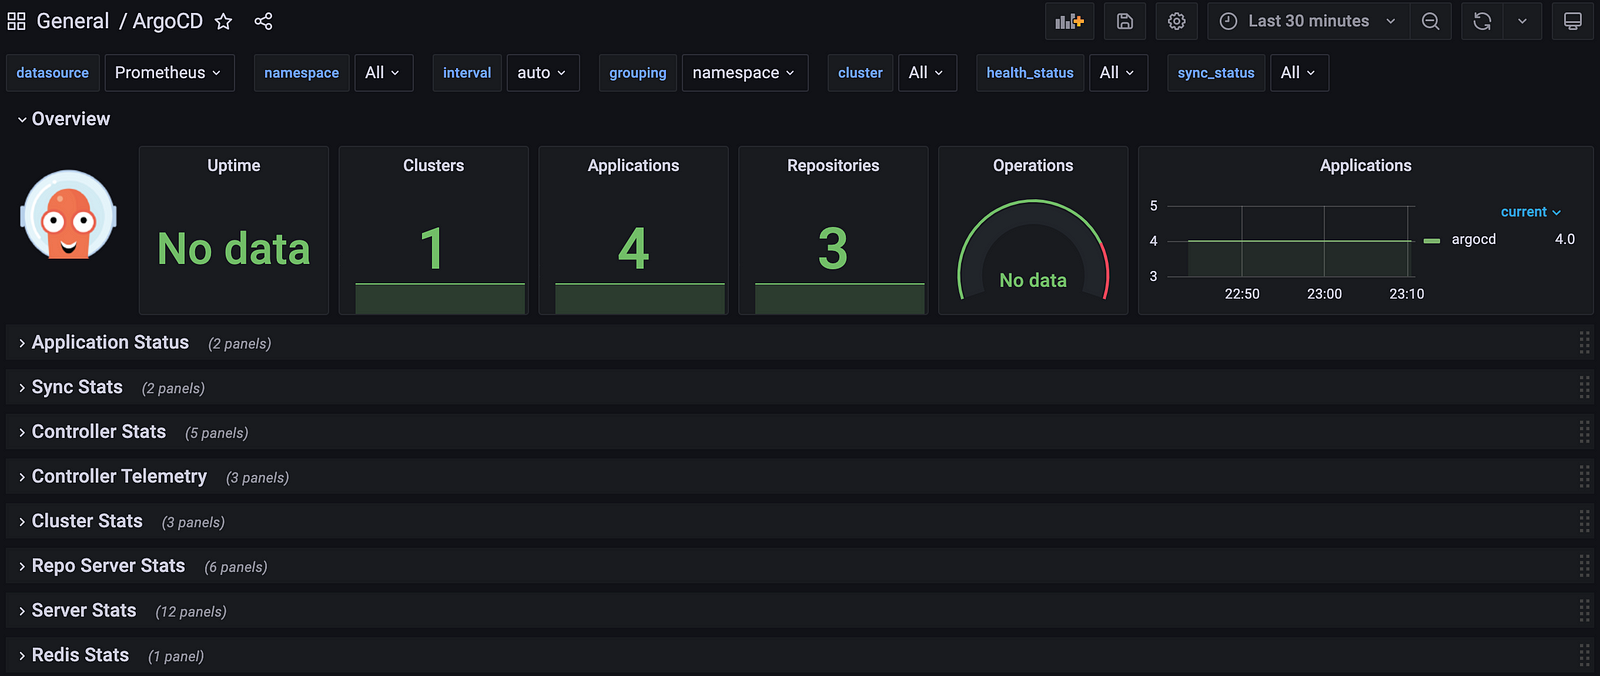
We generated a configMap for the ArgoCD Dashboard and deployed it through kustomization.
During the deployment of Grafana, we linked the configMap to create the Dashboard and then leveraged Prometheus to extract the ArgoCD metrics data for gaining valuable insights into its performance.

The ArgoCD dashboard’s metrics were made available as a result of an earlier section in the blog post:
--set server.metrics.enabled=true \
--set controller.metrics.enabled=true
This enabled us to view and monitor the metrics easily through the dashboard.
Confirm the ArgoCD metrics:
# Verify if the services exist
kubectl get service -n argocd argocd-application-controller-metrics
kubectl get service -n argocd argocd-server-metrics

# Configure port forwarding to monitor Application Metrics
kubectl port-forward service/argocd-application-controller-metrics -n argocd 8082:8082

# Check the Application Metrics
http://localhost:8082/metrics

# Configure port forwarding to monitor API Server Metrics
kubectl port-forward service/argocd-server-metrics -n argocd 8083:8083

# Check the API Server Metrics
http://localhost:8083/metrics
Fire up an Alert
Execute the following script to trigger an alert:
curl -LO https://raw.githubusercontent.com/naturalett/continuous-delivery/main/trigger_alert.sh
chmod +x trigger_alert.sh
./trigger_alert.sh
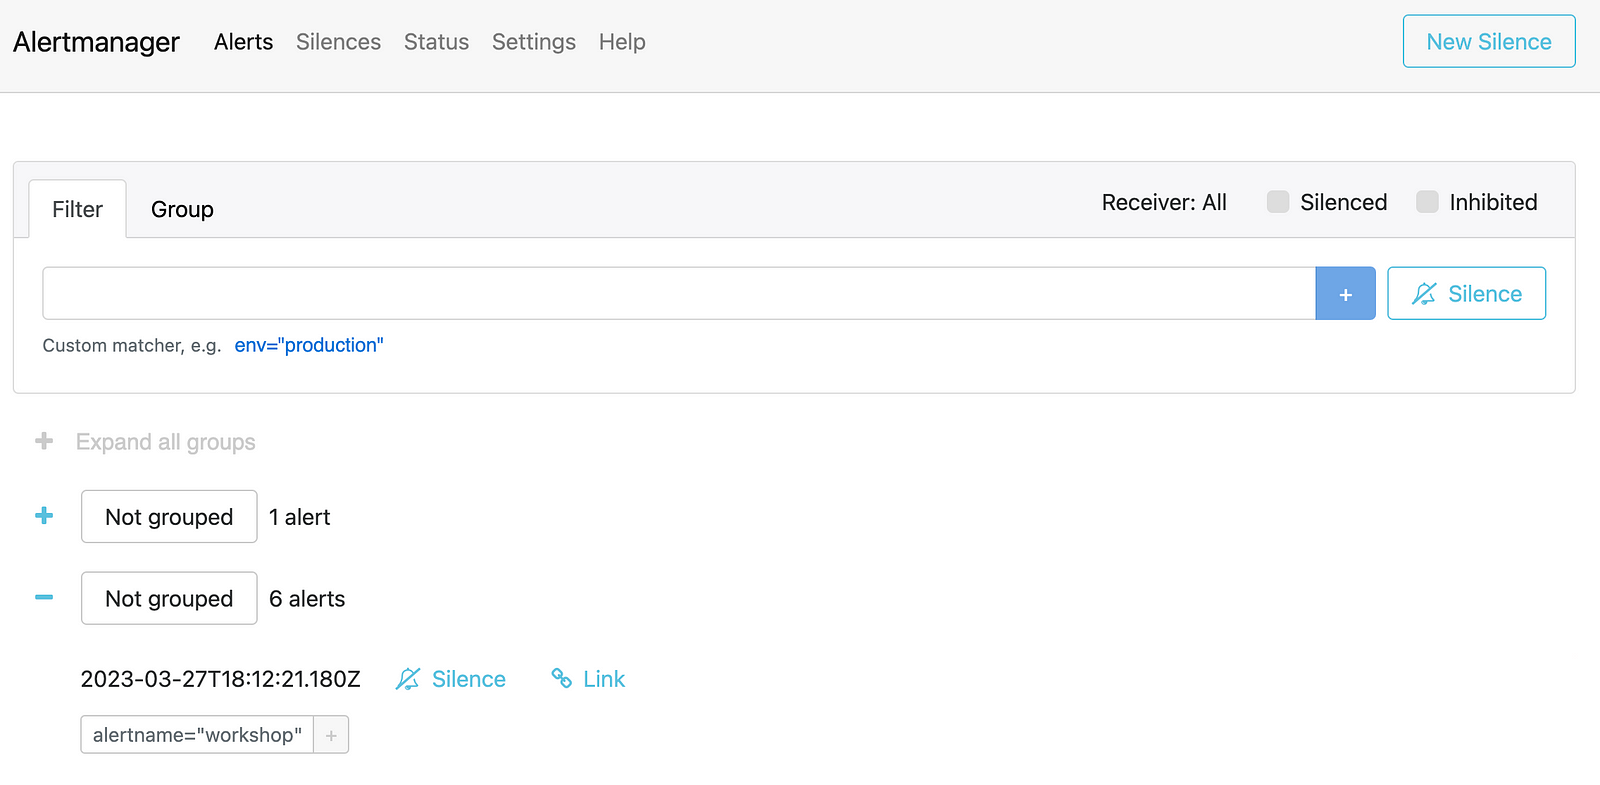
Let’s access the Alert Manager:
kubectl port-forward service/alertmanager-operated -n argocd 9093:9093Connect to Alert Manager.
Confirm that the workshop alert has been triggered:

Clean up the Environment
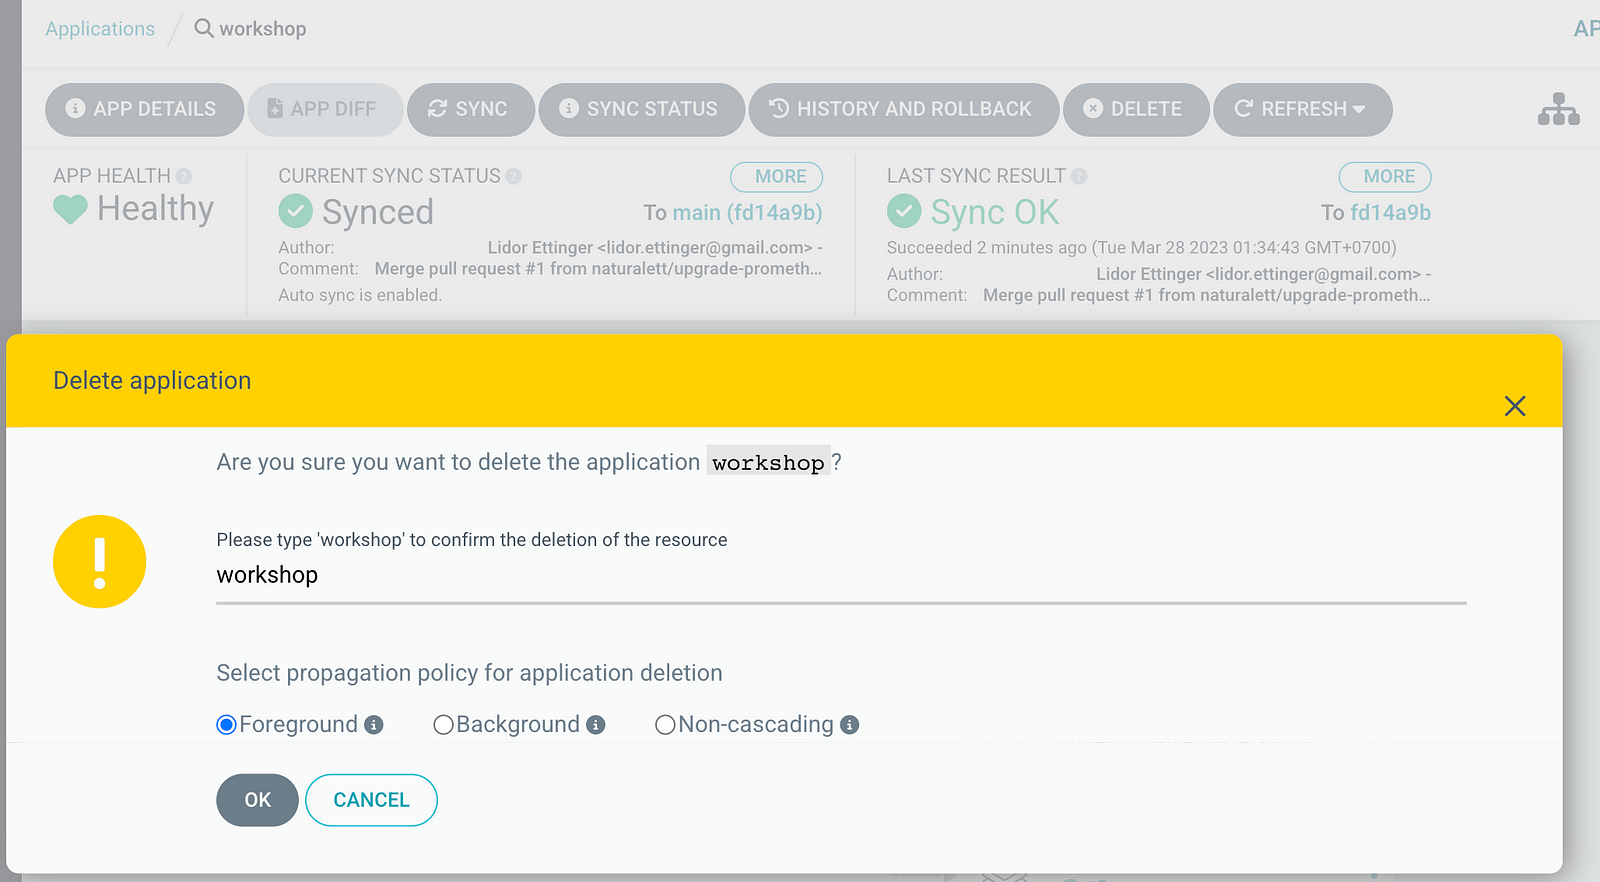
By deleting the workshop ApplicationsSet, all the dependencies that were installed as per the defined kustomization will be removed.

Delete the ArgoCD installation and any associated dependencies:
kubectl delete crd alertmanagerconfigs.monitoring.coreos.com
kubectl delete crd alertmanagers.monitoring.coreos.com
kubectl delete crd podmonitors.monitoring.coreos.com
kubectl delete crd probes.monitoring.coreos.com
kubectl delete crd prometheuses.monitoring.coreos.com
kubectl delete crd prometheusrules.monitoring.coreos.com
kubectl delete crd servicemonitors.monitoring.coreos.com
kubectl delete crd thanosrulers.monitoring.coreos.com
kubectl delete crd applications.argoproj.io
kubectl delete crd applicationsets.argoproj.io
kubectl delete crd appprojects.argoproj.io
helm del -n argocd argocd
Summary
Through our learning process, we have developed proficiency in automating infrastructure management and synchronizing our environment with changes to our source code. Specifically, we have learned how to deploy ArgoCD and utilize its ApplicationsSet to deploy a Prometheus stack. Additionally, we have demonstrated the process of extracting service metrics to Prometheus and visualizing them in Grafana, as well as triggering alerts in our monitoring system. For continued learning and access to valuable resources, we encourage you to explore our tutorial examples on Github.